
Trading strategy every trader should know? A Tactical Approach to Trading Using Breakout Retests, Smart Money Concepts, Supply and Demand Zones, and More
Introduction
In the fast-paced world of trading, understanding the underlying strategies behind market movements can set the foundation for successful investing. Among the plethora of strategies, concepts like breakout retests, smart money, supply and demand zones, chart patterns, and trend lines play crucial roles in helping traders navigate the complexities of the market. In this blog post, we will explore these concepts in depth, providing a tactical approach that traders of all levels can implement to enhance their trading performance.

When it comes to trading, the sheer volume of strategies available can be overwhelming. From scalping and day trading to long-term investments, each approach has its nuances and intricacies. However, certain foundational concepts remain universally applicable, making them essential for every trader regardless of their experience level. In this article, we’ll delve into key trading strategies that every trader should know: breakout retests, smart money concepts, supply and demand, The Strat, chart patterns, reversal candlesticks, and trend lines. Let’s break these down to help you enhance your trading toolkit!
Breakout Retests: Every trader should know this trading strategy.
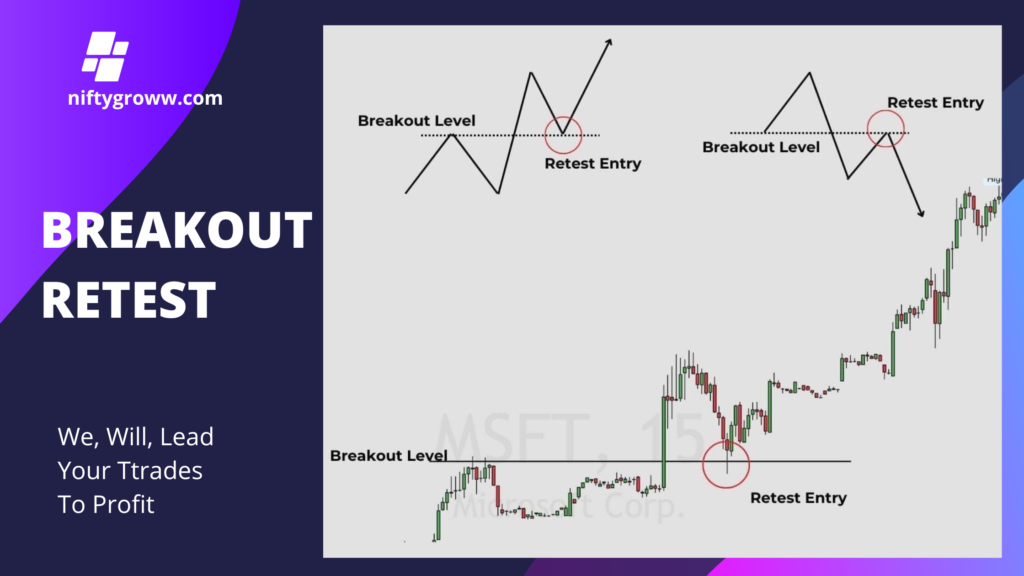
One of the most talked-about strategies in trading is the breakout retest. This involves the price breaking through a defined level of support or resistance and then “retesting” that level. A successful retest can often lead to a strong price move in the direction of the breakout.
Tips for Spotting a Successful Breakout Retest:
- Volume Confirmation: Look for increased volume during the breakout. If the retest occurs on lower volume, it can indicate a lack of seller interest, suggesting a potential continuation.
- Candlestick Patterns: Observe the candlestick patterns that form during the retest. A bullish engulfing or hammer on a support zone could signal a favorable buying opportunity.
- Time Frame Alignment: Confirm that the breakout and subsequent retest align across multiple time frames to increase confidence in the trade.
- Breakout Level: This is the price level at which a security moves beyond a resistance level or support level. A breakout indicates strong momentum in the direction of the price movement.
- Retest Entry: After a breakout occurs, the price often retraces or pulls back to the breakout level. This act of returning to the breakout level is referred to as a “retest.” Traders often look for opportunities to enter trades during this retest, anticipating that the price will bounce off the breakout level and continue in the direction of the breakout.
- Strategy Advantage: Entering trades during a retest allows traders to potentially avoid false breakouts, where the price may quickly reverse after a breakout. This strategy can help in confirming the strength of the breakout and provide a better risk-reward ratio.
- Visual Representation: The image features charts illustrating these concepts with specific breakout and retest levels highlighted, often showing how price behaves around these levels.
In summary, the breakout retest strategy is a popular approach among traders to enhance their entry points and manage risk more effectively in volatile markets.
Smart Money Concepts: Every trader should know this trading strategy.
Smart money refers to the capital that institutional investors, market insiders, and financial professionals manage. They often have access to better information and resources than retail traders, making it crucial to follow their movements.
Key Aspects of Smart Money Concepts
- Identifying Institutional Areas: Look for areas where prices previously reversed or consolidated, suggesting that smart money likely accumulated positions there. These can serve as future support or resistance levels.
- Delta Divergence: Monitor the delta associated with options; significant movement in the underlying asset relative to open interest can indicate smart money activity.
- Volume Analysis: Pay attention to volume spikes in conjunction with price movements. High volume on price rises often indicates that smart money is entering the market.
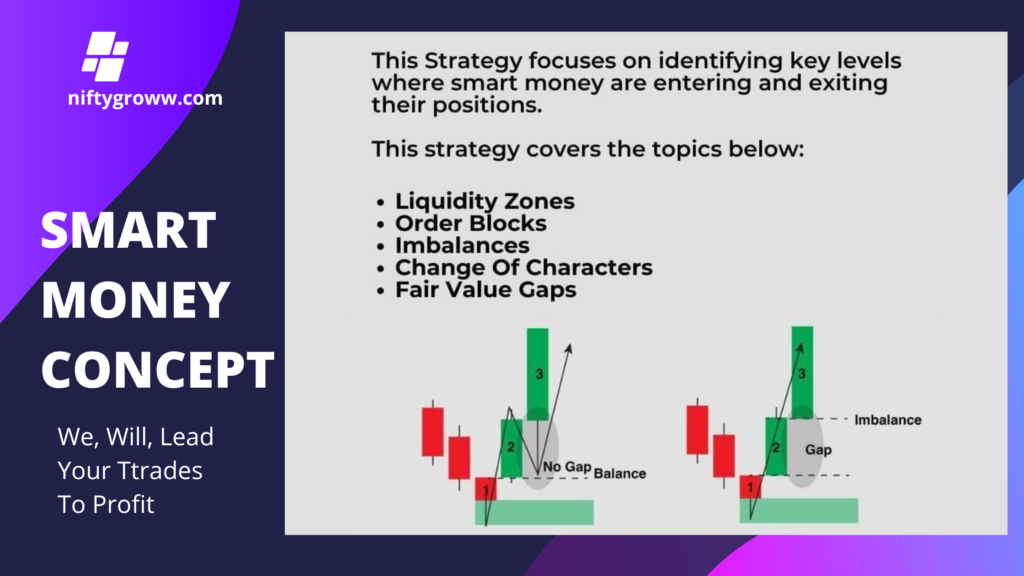
“Smart Money Concepts,” which is a trading strategy aimed at identifying key levels where institutional investors (referred to as “smart money”) are entering and exiting their positions.
Key Topics Covered:
1. Liquidity Zones: Areas where buy and sell orders are concentrated, indicating potential price reversal points.
2. Order Blocks: These are regions where significant buying or selling occurred in the past, which can signal future price movements.
3. Imbalances: This term refers to situations where the number of buyers does not match the number of sellers, resulting in price gaps. The image uses two scenarios to illustrate this:
Balanced Scenario: There is no gap between two candles (represented by numbers 1 and 3), meaning buyers and sellers are evenly matched.
Imbalanced Scenario: A gap exists, suggesting that there were more buyers than sellers during that period.
4. Change Of Characters: This could refer to shifts in market behavior, such as a transition from bullish to bearish momentum.
5. Fair Value Gaps: These are regions of price inefficiency, indicating that prices have moved too quickly in one direction without sufficient countering trades. This suggests a need for price correction to restore balance.
Summary
Overall, this strategy helps traders identify key moments in the market based on institutional activity, enabling them to make informed trading decisions by understanding market dynamics and potential reversals.
Supply and Demand Zones: Every trader should know this trading strategy.
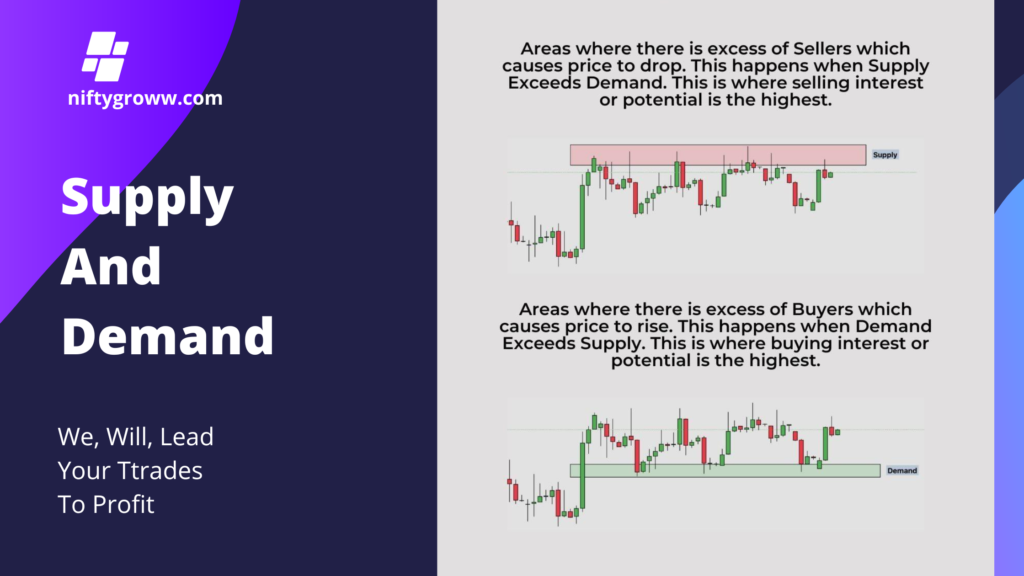
Another critical strategy involves supply and demand zones. These areas highlight where price reversals are likely to happen. A strong supply zone indicates that sellers are prevalent, leading to potential price decreases, while a demand zone signals a cluster of buyers, often leading to price increases.
Tips for Trading Supply and Demand
1. Identify the Zones: Look for areas on the chart where price rapidly reversed in the past. These zones are often visually identifiable as strong price movements.
2. Confirming with Orders: Analyze order flow data, such as order book depth, to identify clusters of buy and sell orders that can influence price movements at these zones.
3. Supply and Seller Excess : – Areas with a surplus of sellers typically lead to a decrease in prices. This occurs when supply surpasses demand. In these situations, selling interest is at its peak, indicating that sellers are more active and willing to offload their assets.
4. Demand and Buyer Excess: – Conversely, areas with a surplus of buyers tend to drive prices up because demand exceeds supply. Here, buying interest is strongest, suggesting that buyers are eager to acquire assets, which pushes prices higher.
The accompanying charts likely illustrate these concepts visually, showing the levels of supply and demand through price movements in trading. Understanding these dynamics helps traders identify potential price trends and make informed decisions.
TheStrat: A Framework for Price Action: Every trader should know this trading strategy.
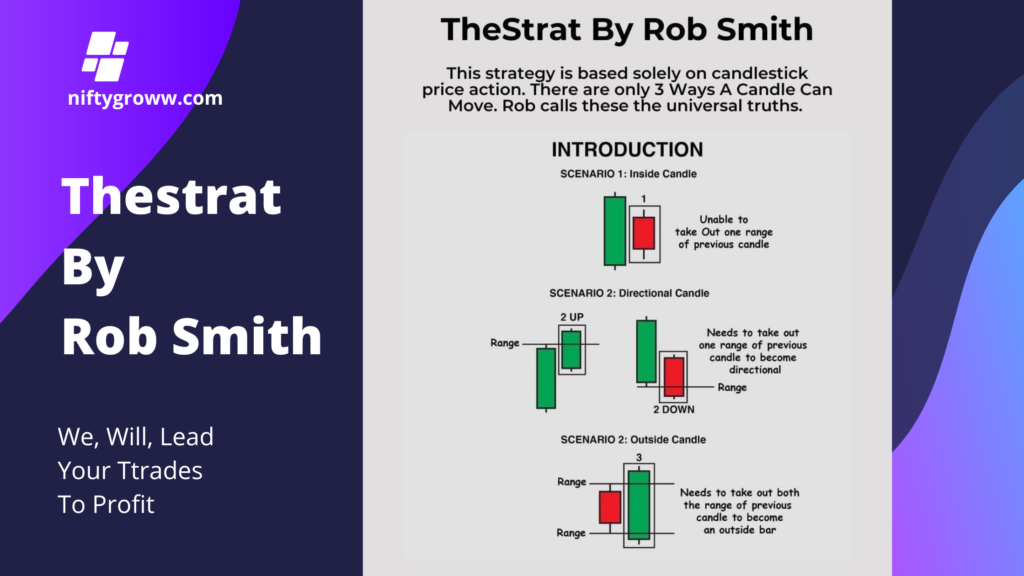
TheStrat, developed by Rob Smith, offers a unique way to analyze market structure through the lens of single candle analysis. This approach teaches traders to:
Identify trend direction through 1-2-3 Pattern recognize trend continuation versus reversal Signals manage risk through precise entry and exit points
The Strat is a unique approach to trading that emphasizes candlestick patterns and market structure. It’s based on identifying the “Strat” criteria for entries, exits, and trade management.
Basic Tenets of TheStrat
1. Identifying the Plays: Use the ratios of inside and outside bars to develop a clear entry and exit plan. This method focuses on specific candlestick formations to indicate potential market direction.
2. Risk Management: The Strat method promotes strict risk management and position sizing, ensuring that you are never risking too much on any single trade.
3. Market Context: Always consider the broader market context. Trading within the trend is often more effective than fighting against it.
4. Inside Candle: This scenario occurs when the current candle’s range (high and low) is entirely within the range of the previous candle. It indicates indecision in the market and is generally seen as a continuation pattern.
5. Directional Candle: This scenario is characterized by a candle that either moves up or down but does not break the previous candle’s range. – If it breaks up, it’s termed “2 UP.” – If it breaks down, it’s termed “2 DOWN.” This signifies potential market direction but requires confirmation by breaking past highs or lows.
6. Outside Candle: This pattern involves a candle that completely engulfs the range of the previous candle, including both the high and the low. For it to be confirmed, it must break the ranges of the prior candle, signalling a strong change in market sentiment.
The strategy emphasizes understanding price action to predict future market movements effectively. Each scenario highlights specific market conditions and potential trading opportunities.
Recognizing Chart Patterns: Every trader should know this trading strategy.
Chart patterns are powerful visual representations of market psychology. Patterns such as flags, pennants, head and shoulders, and triangles can signal potential trend continuations or reversals.
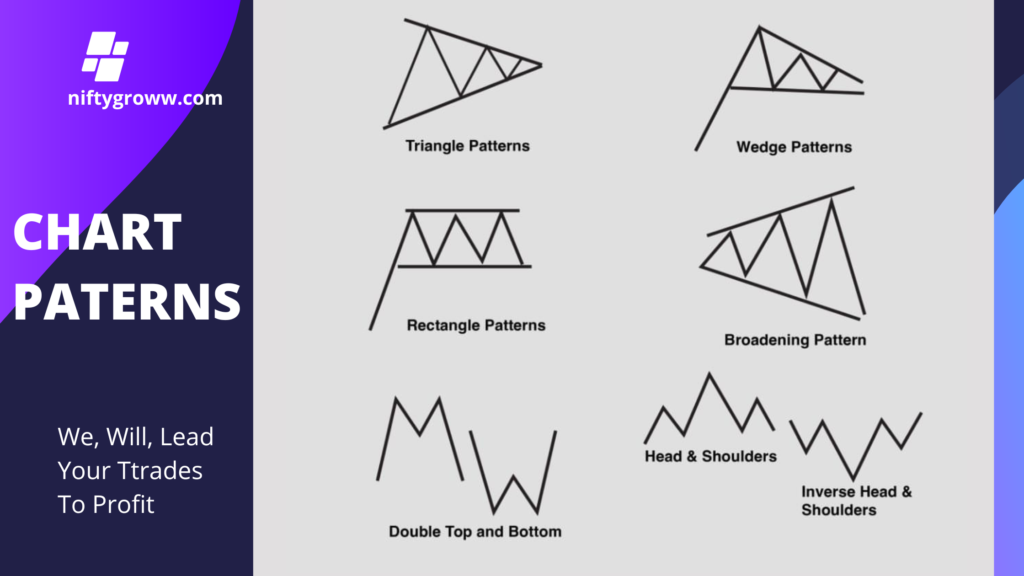
1. Triangle Patterns: These indicate a period of consolidation where price moves within converging trendlines. It suggests that the price may break out in the direction of the prior trend.
2. Wedge Patterns: Similar to triangles, wedges form when the price action is contained within two converging lines, but they tilt in the opposite direction of the prevailing trend, often indicating a reversal.
3. Rectangle Patterns: Also known as trading ranges, these patterns occur when the price moves horizontally between two horizontal lines, indicating indecision in the market.
4. Broadening Pattern: This involves increasing highs and decreasing lows, suggesting high volatility. This pattern indicates potential price reversals after a breakout.
5. Double Top and Bottom: These patterns signal a reversal. A double top indicates a bearish reversal after a price peak, while a double bottom signals a bullish reversal following a price dip.
6. Head and Shoulders: This pattern signifies a reversal following an uptrend (head and shoulders) or a downtrend (inverse head and shoulders). It consists of a peak (shoulder), followed by a higher peak (head), and then another peak (shoulder).
Understanding these chart patterns helps traders anticipate future price movements and make strategic trading decisions.
Decoding Reversal Candlesticks: Every trader should know this trading strategy.
Reversal candlestick patterns signify a change in trend direction. Patterns like pin bars, shooting stars, and dojis can provide valuable insights into possible trend reversals.
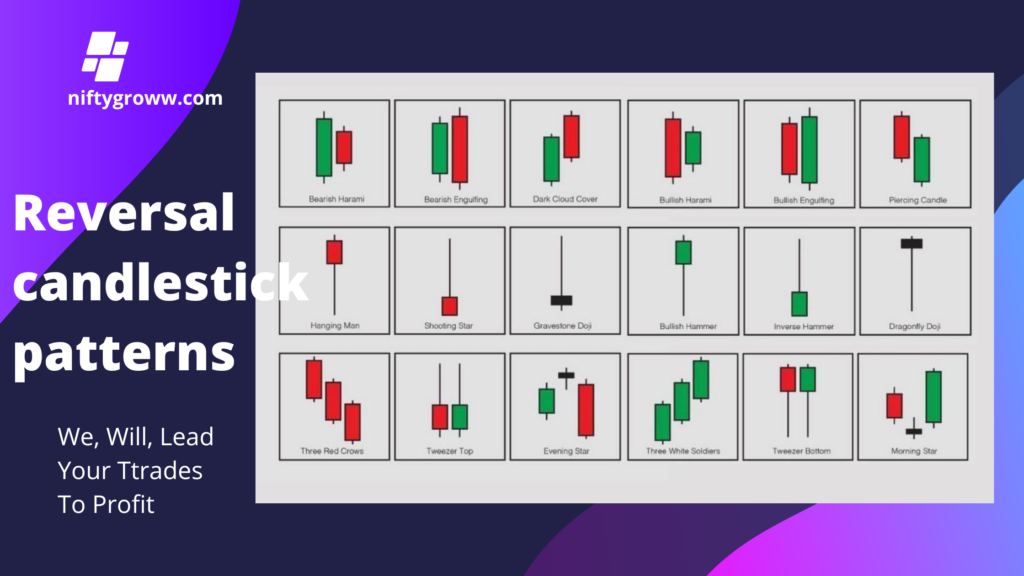
1. Purpose of Reversal Candlesticks: These patterns help in signaling possible changes in market direction, making them essential tools for traders.
2. Types of Patterns:
– Bullish Patterns: Indicate potential upward reversals, e.g., `Bullish Engulfing`, `Piercing Candle`, `Morning Star`.
– Bearish Patterns: Suggest possible downward reversals, e.g., `Bearish Engulfing`, `Dark Cloud Cover`, `Evening Star`.
3. Trading Strategy: The effectiveness of these patterns increases when they appear near key support and resistance levels, as well as in supply and demand zones. Traders use these formations as confirmations to enter or exit trades.
4. Common Patterns Explained:
– Engulfing Patterns: A strong reversal signal where a smaller candle is contained within a larger candle of the opposite color.
– Harami: Indicates potential reversals with a small candle following a larger one.
– Stars and Hammers: Unique shapes that signify buying or selling pressure, often leading to reversals.
5. Visual Identification: The image contains illustrations of each pattern, helping traders visually recognize these formations in their charts.
Conclusion:Understanding and correctly identifying reversal candlestick patterns can enhance a trader’s ability to make informed decisions in the market, especially when aligned with broader technical analysis.
Trendlines Your Market Roadmap: Every trader should know this trading strategy.
Drawing effective trendlines is both an art and a science. Consider these principles:
– Connect at least three points for validation
– Higher timeframe trendlines carry more weight
– Look for confluence with other technical tools
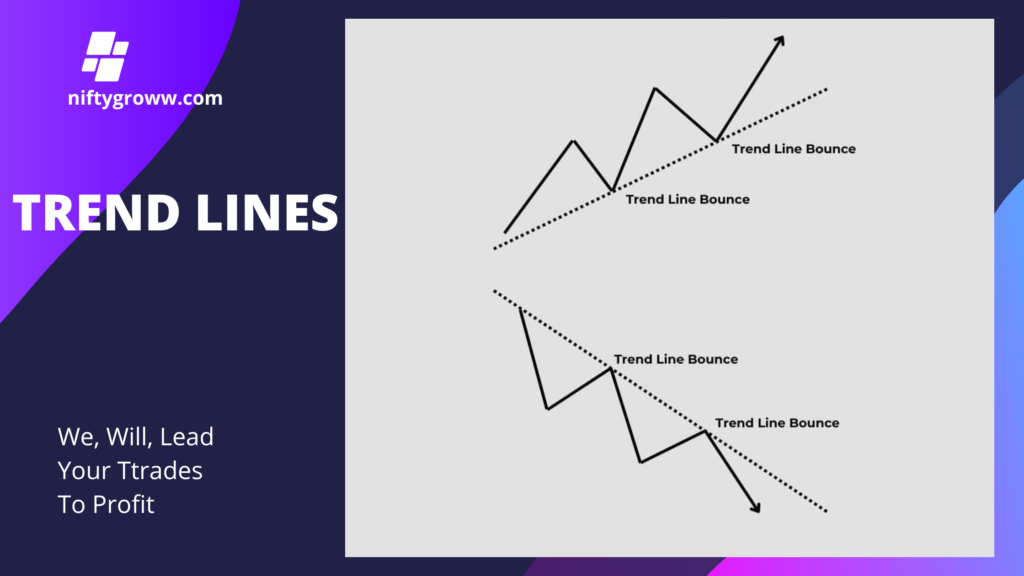
1. Trend Lines: These are diagonal lines drawn on charts that connect significant price points (such as highs or lows). They help traders identify the direction of the market (uptrend, downtrend, or sideways).
2. Market Structure: This refers to the arrangement of price movements and patterns over time, which helps traders determine the prevailing market trend.
3. Understanding Trend Strengths: Recognizing how strongly the price respects these trend lines is crucial. If the price repeatedly bounces off a trend line, it indicates that the trend is strong and likely to continue.
4. Visual Representation: The upper graphic illustrates a bullish trend, where the price consistently bounces off an upward trend line, indicating buying pressure.
– The lower graphic depicts a bearish trend, where the price reacts to a downward trend line, suggesting selling pressure.
In summary, using trend lines effectively requires understanding both the market’s overall trend and its sentiment, which can guide trading decisions.
Also Read : Top 5 EV Stocks in India with High FII Holdings: A Smart Investment Move? Click Here